


Trading forex can be overwhelming because there are many moving parts and factors to consider.
But one thing that makes the process easier is having access to quality charts. Anyone interested in forex trading has probably heard of technical analysis. This strategy relies on the confidence that past price patterns can predict future price movements.
In other words, technical analysis is all about looking at charts to find trading opportunities using your TradingView login. This article looks at five charts that every forex trader should know about. Each can be used to gain valuable insights to help you make better-informed trading decisions.
Top 5 Charts Assist With Forex Trading
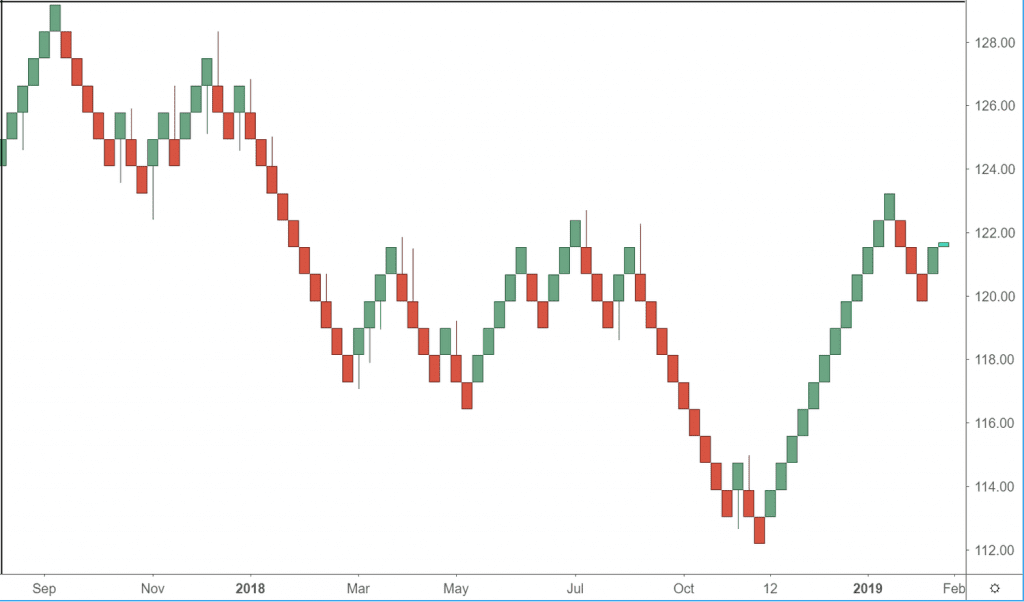
1. Candlestick charts
Candlestick charting is one of the most popular methods of technical analysis among forex traders. These charts provide a clear visual representation of price action and allow traders to identify potential trading opportunities.
Candlestick charts are built using price data from candlesticks, which are bars representing the opening and closing prices as well as the high and low prices for a certain period. The bodies of the candlesticks are colored green if the closing price is higher than the opening price (indicating bullish activity) or red when the closing price falls below the opening price (indicating bearish activity). The wicks show the high and low prices for the period.
One of the main advantages of candlestick charts is that they offer a visually appealing way to see market activity. This can help spot potential reversals or continuation patterns. You can also use candlestick charts with other technical indicators to help confirm trading signals.

2. Bar charts
Bar charts are one of the most popular tools forex traders use to identify potential trading opportunities. A bar chart is simply a graphical representation of price action. Each bar on the chart represents a certain period, such as five minutes, one hour, or one day.
The bar’s height indicates the period’s price range, while the width indicates the trading volume. You can use bar charts to identify both long-term and short-term trends, as well as support and resistance levels.
In addition, many traders use bar charts with other technical indicators to make more informed trading decisions. Whether a beginner or a seasoned pro, incorporating bar charts into your forex trading strategy can help you achieve success in the markets.

3. Line charts
They are the simplest chart type, and they only show the closing price for each period. While this may not seem like much, line charts can still be very useful for identifying overall trends and momentum. For many forex traders, line charts are the go-to choice when it comes time to analyze price action. That’s because line charts provide a clean and simple way to track price movements over time.
But while they may be easy to understand, line charts do not provide much information. That’s because they only show the closing price for each period, which can give you a false sense of how the price is moving. You need to use a candlestick or bar chart to get a more accurate picture of price action. But if you’re starting, line charts can be a helpful tool for getting a feel for the market.
4. Renko charts
Renko charts are among the most popular charting methods forex traders use. They are easy to read and provide a clear picture of price action. Renko charts are constructed using bricks of a fixed size. These bricks are placed at 45-degree angles to each other and are typically the same color as the underlying price Candlestick. The spacing between the bricks is based on price movements.
If prices increase by the required amount, a new brick is added to the top of the chart. If prices move down by the required amount, a new brick is added to the bottom of the chart. The result is a chart that looks like a staircase, with each step representing a price movement in the underlying security. Renko charts are considered more accurate than traditional candlestick charts because they filter out the noise and provide a clear picture of price action.
You can use Renko charts to trade any time frame, but they are most commonly used on intraday charts. When trading with Renko charts, it is important to use support, resistance levels, and trend lines to make your trading decisions.
5. Point and figure charts
Point and figure charting is slightly different from other methods because it only plots price movements when there’s been a significant change. This type of chart plots price movements using a series of X’s and O’s, with each X representing an uptick in price and each O representing a downtick.
By only tracking price movements in this way, point and figure charts can provide a clear and concise picture of overall trends. Moreover, because they only consider price movements of a certain magnitude, they can also help filter out small-scale fluctuations.

Tips For Making Profitable Trades In The Forex Market
Interpreting forex charts correctly can be the difference between making a profit or a deficit. It can be daunting for novice traders to figure out what all the numbers and lines mean. However, with a bit of practice, it becomes much easier. Here are some tips for interpreting forex charts correctly:
- Pay attention to trends: Trends can give you valuable information about the market’s direction. By identifying trends, you can make more informed trading decisions.
- Look at multiple timeframes: It is important to look at forex charts from multiple timeframes to get a complete picture of the market. This will help you make better trading decisions. The time shown on a forex chart depends on your selected time frame. Most forex charts are set to a daily time span by default, showing you the trading data over 24 hours. You can also select other time frames like minutes or months.
- Pay attention to support and resistance levels: These are key price levels where the market has reversal potential. If the market is approaching a support level, it could be a good time to buy; if it’s nearing a resistance level, it might be time to sell.
- Don’t forget about news events: Fundamental analysis is important in forex trading, and news releases can greatly impact prices. Be sure to stay up-to-date on what’s happening worldwide to make informed trading decisions.
Additional: